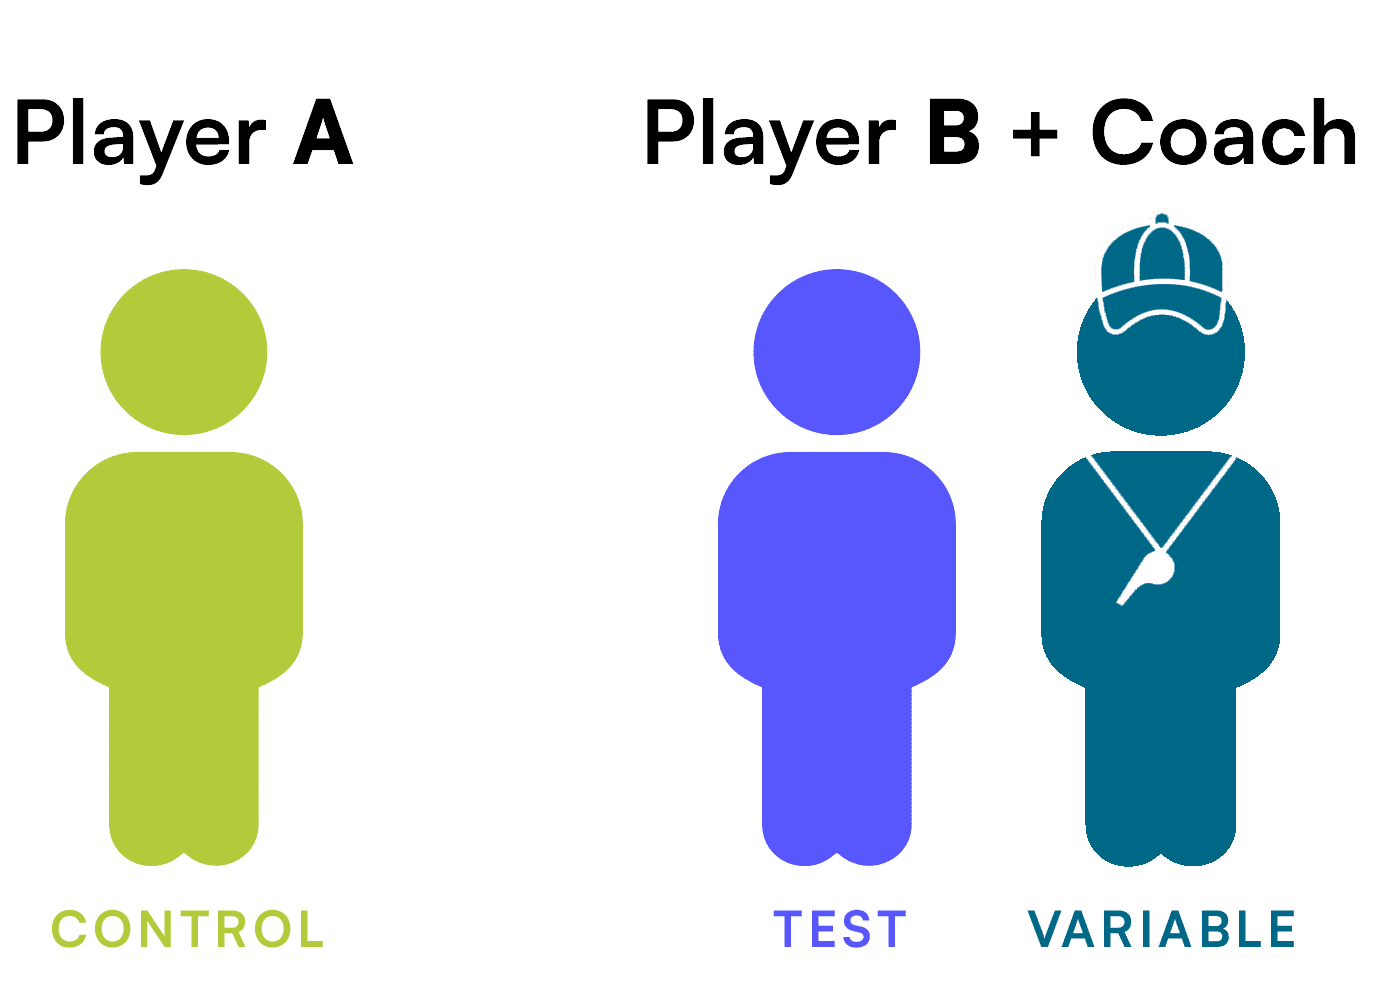
In Part 1 of our Intro to Incrementality series, we went through the basics of incrementality analysis. We talked about our two groups, test (or exposed) and control (or holdout), and how this type of analysis measures the lift caused by a specific variable of one over the other, thereby attaining a true measure of that variable’s impact. In Part 2, we homed in on that control (or holdout) group and explained exactly how to go about creating that group through ghost bidding in a way that avoids skewing the incrementality analysis. So, we’ve covered the basics and we’ve made sure that by the time we get to our incrementality results, we can trust that there’s no skew or bias.
In this last installment, we will discuss the final, and perhaps most important, part of this process: putting this analysis to work in real time. To get to the heart of it, let’s look back on our initial basketball example:
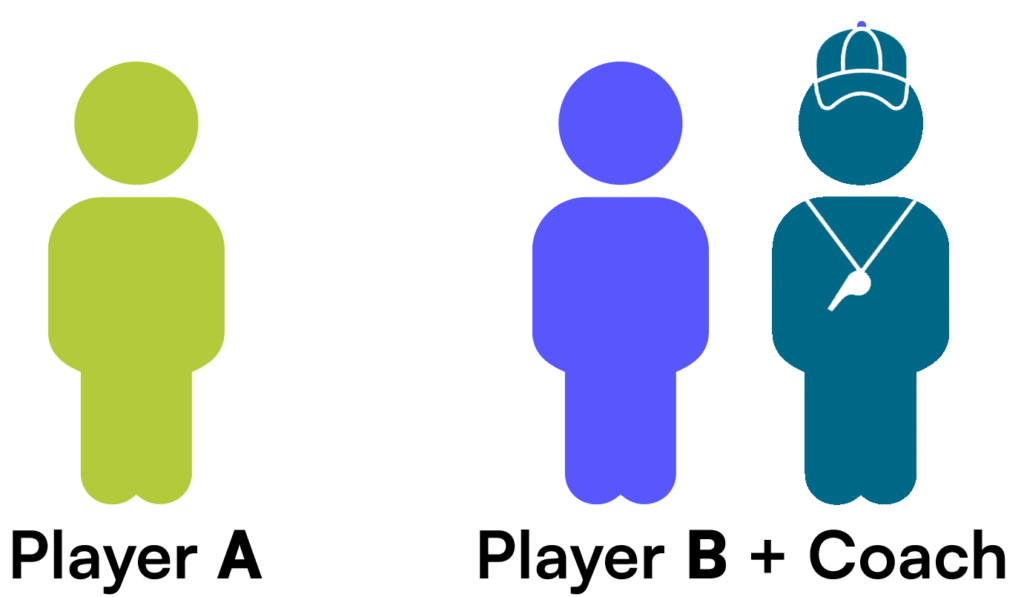
An NBA basketball team has two players who both make 40% of their foul shots. The team wants to improve that percentage, so it decides to hire a shooting coach. It designs a test to evaluate that coach, and assigns him to only one of the two players. Both players are told to do everything else they had been doing, exactly as they had been doing it. For instance, they’re told to spend the same amount of time in the gym, keep asimilar diet, and maintain their same weight. After a year, the player who worked with the shooting coach makes 80% of his free throws the following season, while the player not assigned the shooting coach makes 50% of his free throws.
While this example has been useful in demonstrating the basics of incrementality, the test (the player assigned the coach), the control (the player not assigned the coach), and the new variable (the coach), it neglects some crucial real-world implications.

For starters, if something appears to be working, it doesn’t necessarily benefit the team to wait a whole season to evaluate exactly how well it’s working. If that coach got assigned to the control player mid-way through the season, the results might differ, but it’s quite likely the team could have boosted two players’ free throw percentage instead of one. It’s also worth taking a look at exactly what the coach is doing. Is it just the extra repetitions demanded by the coach that are causing the improvement? Is it an adjustment in form? Is it some mental component or confidence boost? Finally, and most importantly, this coach represents an investment. And the team is paying. The team has to determine if that investment is justified by the incremental improvement. If it is, it has to then determine whether should it increase that investment, and how. Our example simplifies a problem that, in basketball or marketing, is quite messy. The point of this final installment is to discuss cleaning up that mess.
Marketers don’t have an unlimited budget or the luxury of conducting tests in a vacuum. It’s important to note that what incrementality results look like after two weeks might be different than what they look like after two months, but that doesn’t invalidate the two-week results. It’s a continual process of data collection and analysis that should inform decision making. What decision making? We’ll get there shortly.
In our former marketing example, we discussed determining the incremental impact of adding a CTV campaign to a larger marketing mix. The reality is that the CTV campaign very likely consisted of several streaming services, maybe Sling, Hulu, and Pluto, and several creatives, maybe a:30 second creative and two :15 second creatives, across more than one audience, maybe an intent-based audience and a demographic-based audience. When we conduct this type of analysis, it’s important to get more granular than just the overall media type to unearth additional valuable insights.
We cannot, and should not, treat this analysis as independent of cost.
How do we put this analysis to work in real time, granularly, and factoring in cost? We apply it to campaign optimization. Here’s another marketing example:
A brand decides to add a $1k CTV test to their marketing mix that previously consisted only of search and social media campaigns. The brand’s goal is to optimize toward the lowest cost-per-checkout (CPC) possible for its CTV campaigns. The brand has only one creative and is testing only one intent-based audience, but it doesn’t want to put all its eggs in one basket, so it decides to test three publishers, Sling, Hulu, and Pluto TV.
Most performance CTV vendors don’t report incremental conversions, so the brand observes the following checkouts and cost-per-checkout across the variables in the CTV campaign.

Any brand that sees those results would think: “well, it looks like Sling is the best, we should put more budget there and less budget in Hulu and Pluto TV”—and, in a vacuum, the brand would be absolutely correct. But media doesn’t work in silos, it works across silos, and the brand is also running search and social, plus, it’s got all this organic demand it worked so hard to build up.
The brand, knowing this, decides to add incrementality analysis as an additional data point, and it finds that Sling’s incrementality percentage is 10%, Hulu’s is 80%, and Pluto TV’s is 50%. In other words, it finds that 90% of conversions recorded from Sling would have happened despite those Sling exposures, 20% of conversions recorded from Hulu would have happened despite those Hulu exposures, and 50% of those conversions recorded from Pluto TV would have happened despite those Pluto exposures.

This is worrisome and tricky when it comes to future budget allocation. What the brand is seeing is a commonplace occurrence in the marketing world: conversions reported by platforms are duplicative because each platform the brand operates in works only with the media it runs. So the brand’s CTV vendor takes credit for its social media conversions, the brand’s search vendor takes credit for its CTV conversions, and so on.
But the brand has a secret weapon: incrementality-informed optimization. Instead of using only CPA metrics, the brand can, very simply, apply the incrementality analysis to the cost-per-checkout and the result is a new metric: cost-per-incremental-checkout (iCPC). By multiplying the number of checkouts and the incrementality percentage, the brand unearths the below results:

The takeaway? Without incrementality analysis applied to the brand’s performance numbers, it would have been optimizing its CTV campaign in a way that was actually counter to its bottom line, toward conversions that would have happened anyway. By adding this additional analysis, it can actually see it would be best served spending more on Hulu, and that the top performer from only a CPC standpoint (Sling) actually finishes well behind the top performer from an iCPC standpoint (Hulu).
As brands get smarter with their budget allocation across and within media types, incrementality analysis becomes a crucial stepping stone on the path to profitability and cross-channel ROAS.
The Digital Remedy Platform not only offers incrementality analysis but also allows brands the option to leverage incrementality-informed optimization strategies, ensuring that their CTV dollars are getting put to work efficiently within a cross-channel media mix. To learn more speak to a member of our team today.
In our first Intro to Incrementality piece, we explained what incrementality analysis is and how marketers can use it to make more informed decisions about what success means for their media campaigns. We mentioned how, at the very heart of this analysis, there is a comparison between two groups:
In this part of our incrementality series, we talk specifically about that second group, diving deeper into how to create a control group and what it should be composed of for unskewed analysis.
Remember our basketball example? Here’s a quick refresher:
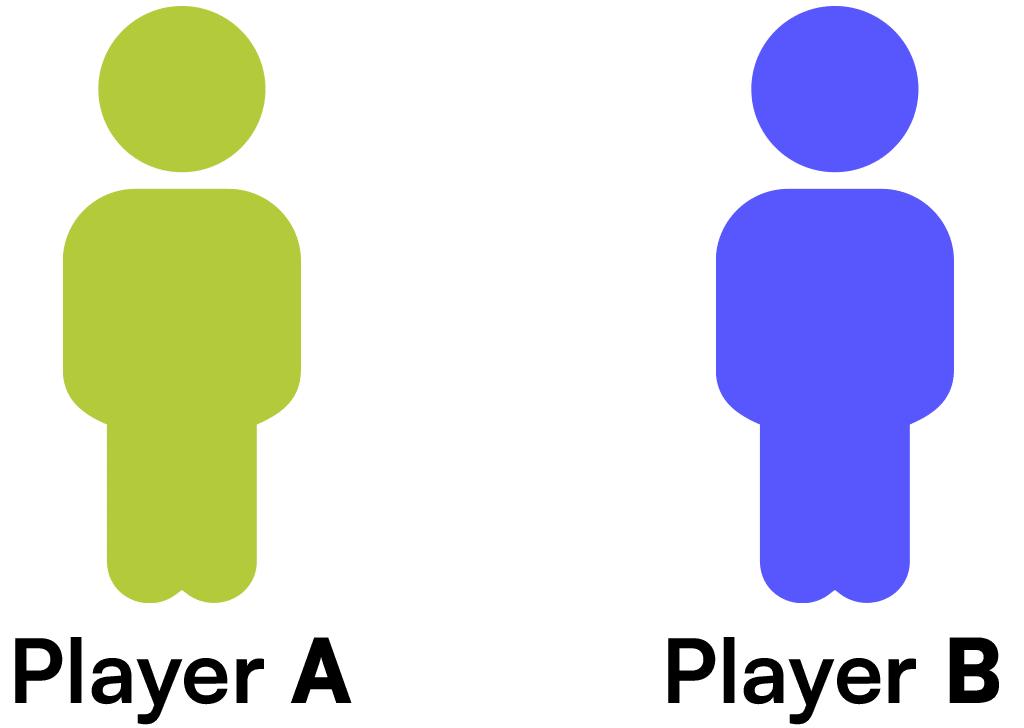
An NBA basketball team has two players who both make 40% of their foul shots. The team wants to improve that percentage, so it decides to hire a shooting coach. It designs a test to evaluate that coach and assigns him to only one of the two players. Both players are told to do everything else they had been doing, exactly as they had been doing it. For instance, they’re told to spend the same amount of time in the gym, keep a similar diet, and maintain the same weight.
Player A: 40% of free throws ┃ Player B: 40% of free throws

After a year, the player who worked with the shooting coach makes 80% of his free throws the following season, while the player not assigned the shooting coach makes 50% of his free throws.
Player A: 50% of free throws ┃ Player B: 80% of free throws

There are some very important concepts embedded in this example but two are chief among them. First, both players make 40% of their shots. The observed behaviors of both groups are similar, if not the same. Second, everything else going on—except the shooting coach—remains the same. No after-practice shots allowed, no extra weight room, etc. Allowing additional variables into the equation creates noise that can skew or obscure incrementality analysis.
Bringing this back to marketing, we’re left with this challenge: how can we create a control group where the observed or expected behaviors match the exposed group, and how can we limit the noise around this analysis? Prior to 2020, there were three common methods for creating control (or holdout) groups for marketing and advertising campaign analysis:
Pick two similar markets, turn media or a certain type of media on in one market, leave it off in the other, and observe behavior in each. The issue with market A/B testing is that no two markets behave exactly alike, no two markets contain populations that are comprised of the exact same demographics and interests, and the background noise can reach dangerous levels.
Using existing technology and cookie, IP, or Mobile Ad ID (MAID) lists, agencies and advertisers were able to actively hold out randomly generated subsets of people from seeing ads. However, as soon as targeting is applied to the campaign, the analysis skews heavily toward the exposed group. For example, imagine you’re selling men’s running shoes and you want to run incrementality analysis. Your campaign is targeting men, but your randomly-generated control is observing men and women equally. Your exposed group is going to perform better because half the control group can’t even buy your product.
The exposed group, with all its relevant demographic and behavioral targeting, is served ads for the brand. Meanwhile, that same demographic and behavioral targeting is applied to a different group, and instead of ads for the brand, they’re served ads for public service or completely unrelated products or activities. The two groups remain separate and distinct but mirror each other in behaviors essentially (e.g. back to the basketball example: they both shoot 40% at the line). This allows us to see a much-less-skewed, noise-filled outcome of the incrementality test running.
The main drawback of PSA holdouts is that someone has to pay for that PSA ad to be served. Impressions don’t come free, and in order to run this analysis, impressions must actually be purchased to run PSA ads on, so a substantial portion of the advertising budget is going toward actively NOT advertising! Additionally, when a PSA is served, it actually prevents competitive brands from winning that same impression and possibly swooping in on a customer, which might be good for business but is very bad for statistics—and creates a skew toward the exposed group.
In 2020, a new method for creating a holdout emerged called ghost bidding, which allows media buyers to create a holdout by setting a cadence against individual line items or ad groups. The cadence dictates how often the buying platform will send an eligible bid into the control group, instead of actually bidding on the impression. So, at a ghost bid cadence of 20%, for every 5 impressions bid on, 1 user receives a “ghost bid”, or gets placed in a holdout group where it cannot receive ads for the duration of the campaign.
Because the ghost bid isn’t an actual impression, the ad space remains open and the “ghost bid” is free. Additionally, because it’s set against the line item or ad group itself, all the targeting matches the exposed group exactly and all optimization on the exposed group follows suit on the control group. If Millennial Urban Men are converting at a higher rate and receiving more budget in the exposed group, they’re also receiving more ghost bids, making sure the composition of the control follows suit.

Ghost bidding addresses the pitfalls of market tests, random samples, and PSA’s while remaining inexpensive and relatively easy to implement. As a result, ghost bidding has become increasingly popular with sophisticated marketers and media buyers. It is Digital Remedy’s preferred method for creating holdouts for our Digital Remedy Platform.
In our next piece of this series, learn why optimizing incrementally is a crucial capability for brand marketers and agencies looking to drive tangible bottom-line results. Can’t wait? Check out our full insights report or speak to a member of our team today.