Feb 19, 2025
—
In Part 1 of our Intro to Incrementality series, we covered the basics of how incrementality analysis helps marketers uncover the true impact of their advertising by comparing two groups: At its core, incrementality analysis answers the critical question: Did this ad actually cause the action, or was it just along for the ride? Now…

In Part 1 of our Intro to Incrementality series, we covered the basics of how incrementality analysis helps marketers uncover the true impact of their advertising by comparing two groups:
At its core, incrementality analysis answers the critical question: Did this ad actually cause the action, or was it just along for the ride?
Now we’ll dive deeper into how to create the perfect control group—a crucial step for ensuring your incrementality analysis delivers actionable, unskewed results.
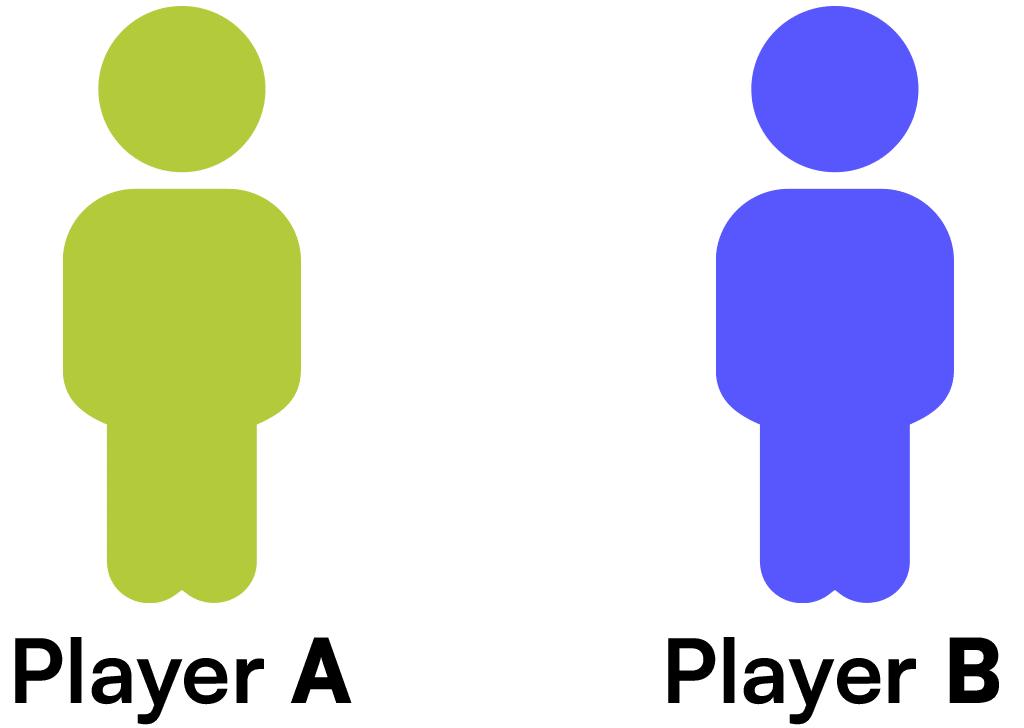
Let’s revisit our basketball analogy from Part 1 for a quick refresher. Imagine an NBA team with two players who both make 40% of their free throws. To improve performance, the team hires a shooting coach but assigns him to work with only one player, Player B. Both players maintain the same training, diet, and gym routines.
Player A: 40% of free throws ┃ Player B: 40% of free throws

After the 2025–26 season, Player B’s free throw percentage improved to 80%, while Player A’s percentage rose to 50% due to natural improvement. The difference between these results helps isolate the coach’s impact.
Player A: 50% of free throws ┃ Player B: 80% of free throws

The takeaway? For a valid test, the control group (Player A) and test group (Player B) must be similar in baseline behavior, with only the variable of interest (the coach) changing. Allowing additional differences—like varying diets or gym routines—would introduce noise and obscure the results.
Marketers face unique challenges in creating effective control groups:
Before 2020, there were three common methods for creating control groups in digital advertising:
1. Market A/B Testing
Pick two similar geographic markets, turn ads on in one market, and leave them off in the other. Observe and compare behavior in each market.
Challenges:
2. Random Suppressed Groups
Randomly exclude subsets of people from seeing ads using digital identifiers like cookies, IP addresses, or mobile ad IDs (MAIDs).
Challenges:
3. PSA Ads
Serve Public Service Announcement (PSA) ads to the control group instead of your brand’s ads. This ensures both groups are behaviorally and demographically similar.
Challenges:
In 2020, ghost bidding revolutionized control group creation. By simulating bids without serving ads, ghost bidding eliminates many of the challenges associated with traditional methods.
How it Works:
Advantages of Ghost Bidding:

Ghost bidding addresses the pitfalls of market tests, random samples, and PSAs while remaining inexpensive and easy to implement. That’s why Digital Remedy uses ghost bidding as the preferred method for creating control groups in the Digital Remedy Platform.
Effective control groups are the foundation of accurate incrementality analysis. By leveraging ghost bidding, brands and agencies can minimize bias and gain actionable insights into their campaigns.
In Part 3, we’ll explore how to put incrementality analysis to work in real time, driving smarter optimizations and improved ROI. Want to get started now? Speak with a member of our team today and take your marketing performance to the next level.
Related Posts

In Part 1 of our Intro to Incrementality series, we covered the fundamentals-measuring incremental lift by comparing test (exposed).

In Part 1 of our Intro to Incrementality series, we covered the basics of how incrementality analysis helps marketers.

The State of Digital CPG Advertising Digital marketing is transforming how Consumer Packaged Goods (CPG) brands bond with their.